
Tracing Serverless Applications with AWS X-Ray

In the world of serverless architectures, understanding how requests flow through your distributed system can feel like navigating a maze blindfolded. AWS X-Ray emerges as your guiding light, providing the visibility needed to trace requests as they traverse through Lambda functions, API Gateway endpoints, SQS queues, and other AWS services.
Sponsored by Salesforce
The shift toward Agentic AI isn’t just another buzzword—it’s redefining how we design, architect, and build modern systems.
That’s exactly why I’ll be tuning into TDX on Salesforce+ to explore how Agentforce is shaping the next generation of the developer roadmap.
If you’re serious about staying ahead of the curve, I highly recommend grabbing a free spot and joining the sessions.
Plus, when you register, you’ll be automatically entered for a chance to win one of 20 AI exam vouchers (valued at $200)—available to legal residents of the U.S., Canada, New Zealand, and the U.K.

Stream the developer conference of the year. Live on Salesforce+.
Agentic AI is changing the game and Agentforce is leading the way. Stream TDX to join dozens of sessions and virtual hands-on trainings that explore the latest innovations across Agentforce, Data 360, the core platform, vibe coding, Slack, and more. All free on Salesforce+.
Tune in to TDX on Salesforce+ to:
Build hands-on skills with virtual trainings and live demos
Get roadmap insights from the leaders shaping what’s next
Access broadcast-only moments and exclusive interviews
It all kicks off with the main keynote, where you’ll experience the future of software and learn how to build it. Add it to your calendar so you don’t miss a moment.
👉 Register for free
Why Tracing Matters in Serverless
Serverless applications are inherently distributed. A single user request might trigger an API Gateway endpoint, invoke multiple Lambda functions, write to DynamoDB, publish messages to SNS, and queue tasks in SQS. When something goes wrong, or even when you’re optimizing performance, pinpointing the bottleneck becomes challenging without proper tracing.
X-Ray solves this by creating a complete map of your request journey, showing you exactly where time is spent, where errors occur, and how services interact with each other. It’s the difference between guessing and knowing.
Understanding the Service Map
The service map is X-Ray’s visual representation of your application architecture. It automatically discovers and displays all the services your application uses, showing the relationships between them. Each node represents a service, and the connections show how requests flow between them.
What makes this powerful is the real-time health indicators. You can immediately spot services with high error rates or elevated latency. The color coding provides instant visual feedback, green for healthy, yellow for warnings, and red for errors. This bird’s-eye view helps you understand your system’s behavior at a glance.
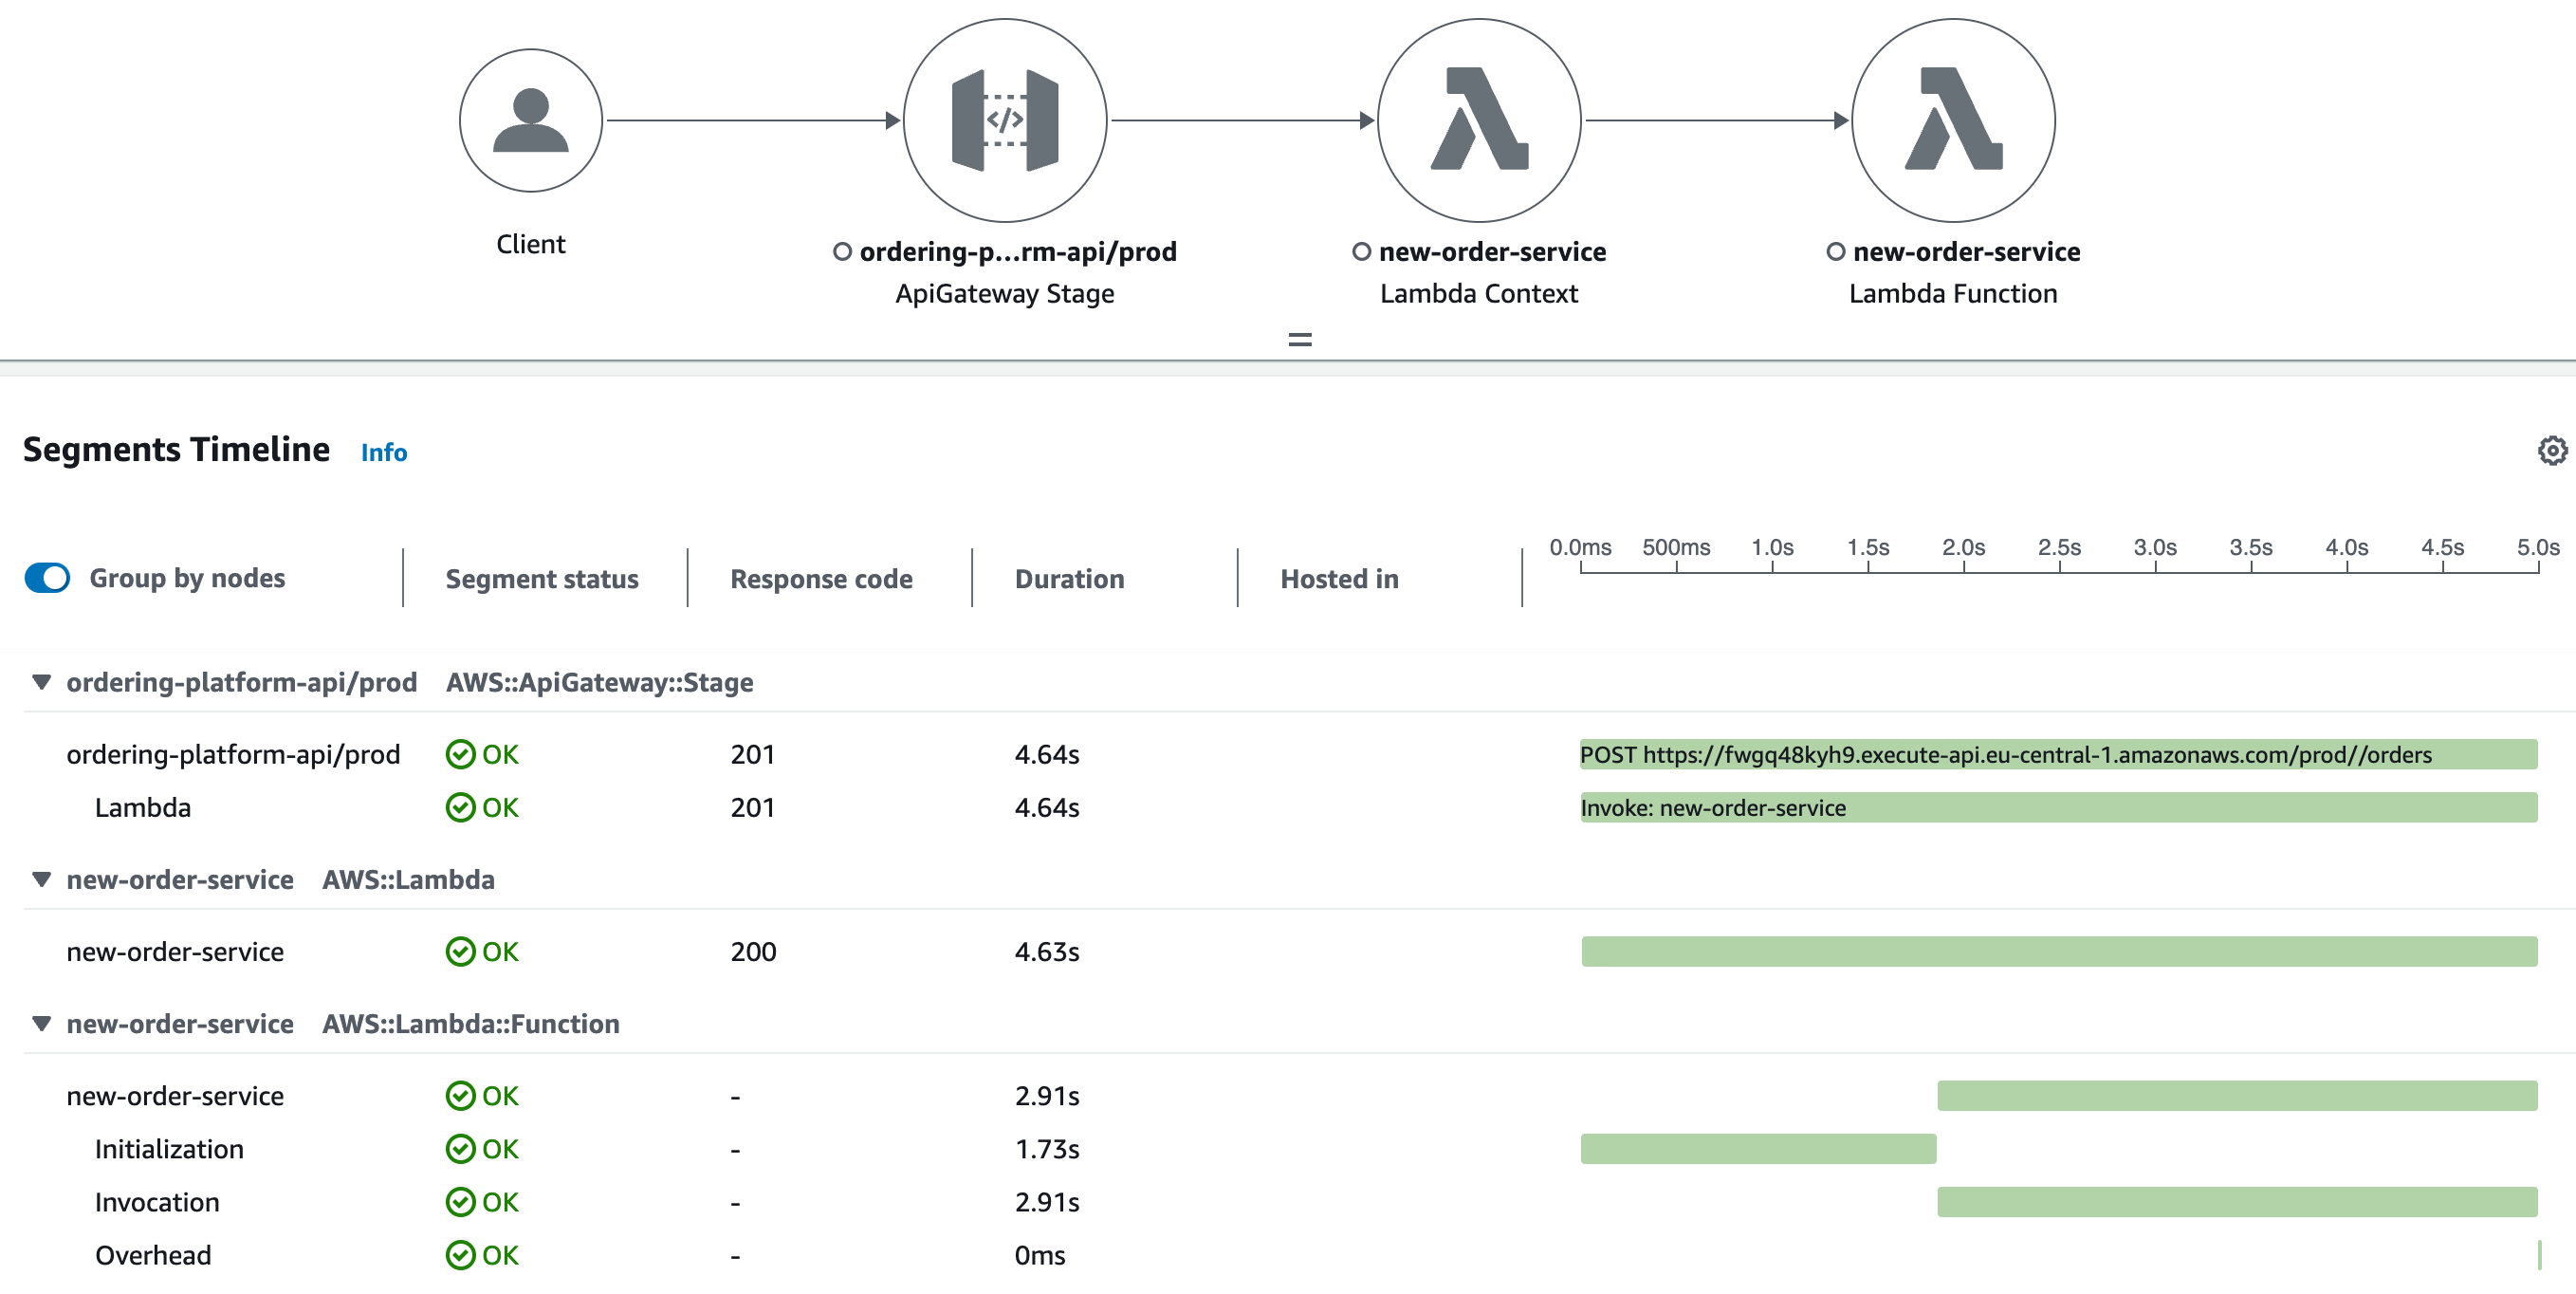
Traces and Segments: The Building Blocks
Every request that flows through your application creates a trace. Within each trace, individual services create segments that represent the work they perform. For Lambda functions, a segment captures the entire function execution. For downstream calls to DynamoDB or other services, subsegments provide granular detail.
The trace timeline shows you exactly how long each segment took, helping you identify slow operations. You can drill down into specific traces to see the complete request path, including all the metadata, annotations, and errors associated with each segment.
Practical Tips for Effective Tracing
Start with sampling strategies wisely. X-Ray uses sampling to balance cost and visibility. The default sampling rule captures the first request each second and 5% of additional requests. For production environments, this is usually sufficient. However, for critical workflows or during troubleshooting, consider creating custom sampling rules to capture 100% of specific API paths or error conditions.
Use annotations for filtering and grouping. Annotations are indexed key-value pairs that you can use to filter traces in the X-Ray console. Add annotations for user IDs, transaction types, or feature flags. This makes it easy to analyze specific user journeys or compare performance across different code paths.
Leverage metadata for context. Unlike annotations, metadata isn’t indexed but provides rich contextual information when viewing individual traces. Include relevant business context, configuration values, or debugging information that helps you understand what was happening during the request.
Monitor cold starts separately. Lambda cold starts can significantly impact performance. Use X-Ray annotations to tag cold start invocations, allowing you to analyze their frequency and impact separately from warm starts. This helps you make informed decisions about provisioned concurrency.
Set up alarms on key metrics. X-Ray integrates with CloudWatch, allowing you to create alarms based on error rates, latency percentiles, or fault rates. Don’t wait to discover problems, let X-Ray notify you when thresholds are breached.
Trace asynchronous workflows. For event-driven architectures using SNS, SQS, or EventBridge, ensure you’re propagating trace context through message attributes. This maintains the trace continuity across asynchronous boundaries, giving you end-to-end visibility even in complex event chains.
Use trace groups for organization. As your application grows, create trace groups to organize and filter traces by environment, application component, or team ownership. This keeps your X-Ray console manageable and helps teams focus on their specific services.
The Bottom Line
AWS X-Ray transforms serverless observability from reactive debugging to proactive optimization. By providing clear visibility into request flows, performance characteristics, and error patterns, it empowers you to build more reliable and efficient serverless applications.
The key is to integrate X-Ray early in your development process, not as an afterthought when problems arise. With proper instrumentation and thoughtful use of annotations and sampling, X-Ray becomes an invaluable tool for understanding and improving your serverless architecture.